Can we trust the close?
I rebuild reconciliations, journal entries, AP/AR, payroll accounting, revenue, inventory/COGS, workpapers, and review so leaders know what is supported and what remains open.
 Diego Daniel Moro
Controller and strategic finance
Diego Daniel Moro
Controller and strategic finance
Controller | Strategic Finance | Finance Systems
The close, cash forecast, operating model, and reporting cadence are useful only when they make the tradeoffs clear before a company commits. At Digital Infrastructure Inc. (DBA: DIMO), that meant reducing close from 18-20 days to 3-5 and supporting about $19M of fundraising work.
I personally led and prepared the R&D tax credit filing and completed the VAT recovery work. The status of each amount is kept explicit so expected cash is not confused with credits that reduce future taxes.
R&D credit cash expected to be collected; the filing is complete and collection remains pending.
R&D credits available and being applied to reduce taxes.
Overpaid VAT recovered after the reconciliation and recovery process was completed.
My strongest work sits where accounting, forward-looking finance, and operating data have to produce one clear decision.
I rebuild reconciliations, journal entries, AP/AR, payroll accounting, revenue, inventory/COGS, workpapers, and review so leaders know what is supported and what remains open.
I connect cash, runway, driver-based forecasts, headcount, SaaS and unit economics, board reporting, and fundraising so the tradeoffs are visible before a commitment.
I connect accounting systems, BigQuery, Fivetran, Looker, Metabase, SQL, and Python so the answer ties back to a source someone else can trace.
Three short, sanitized work samples show how I diagnose the problem, verify the numbers, and make the next decision clearer.
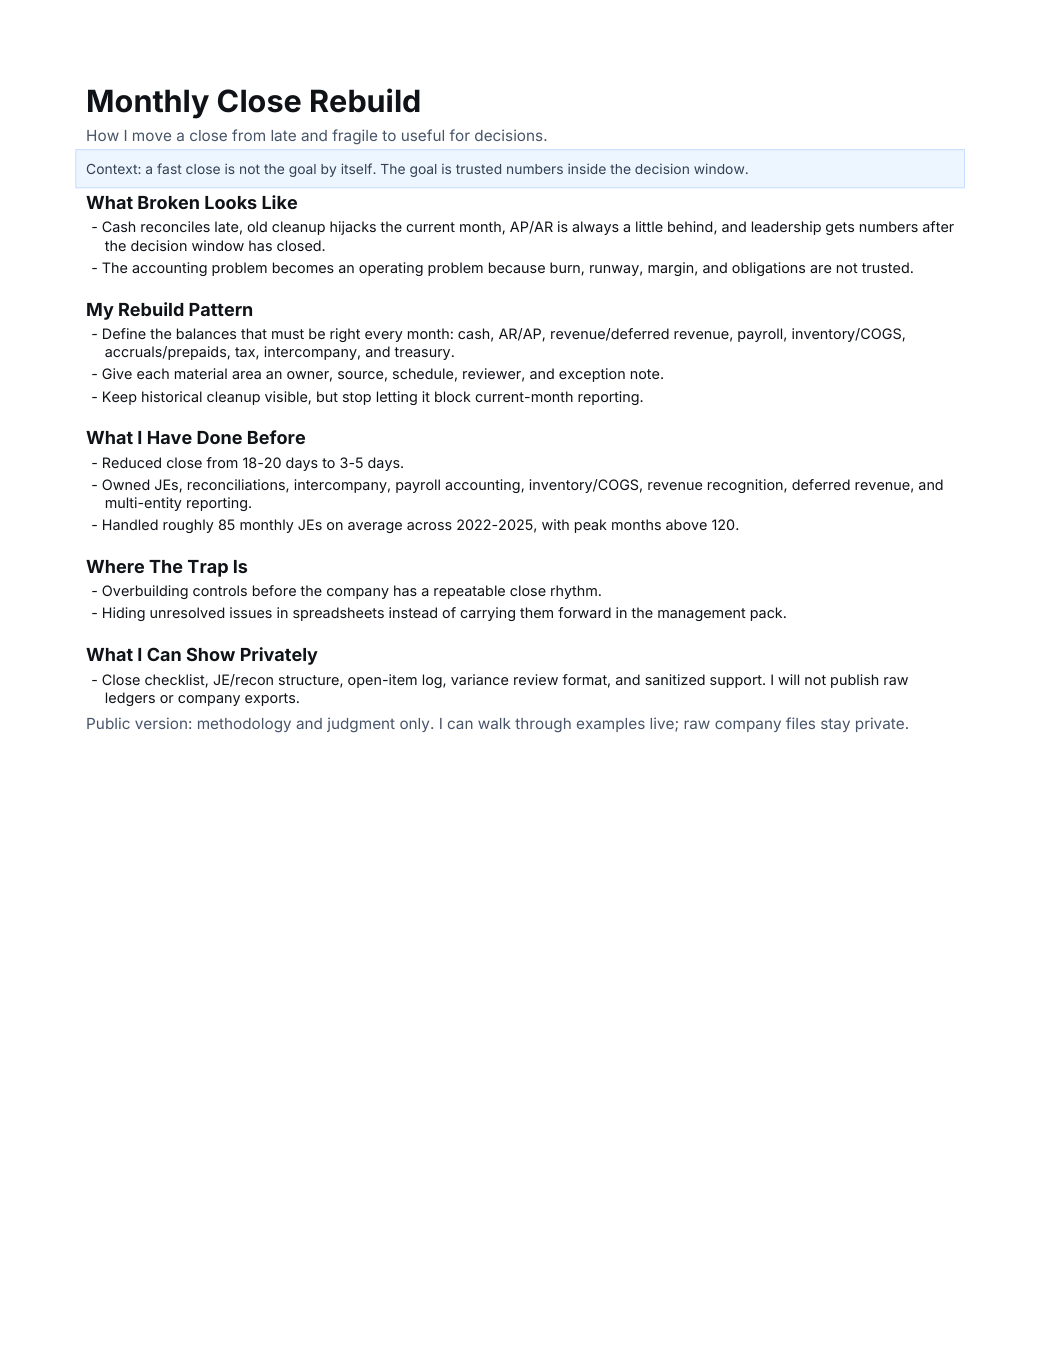 Monthly Close Rebuild
Ownership, reconciliations, evidence, and review for a faster, controlled close.
Monthly Close Rebuild
Ownership, reconciliations, evidence, and review for a faster, controlled close.
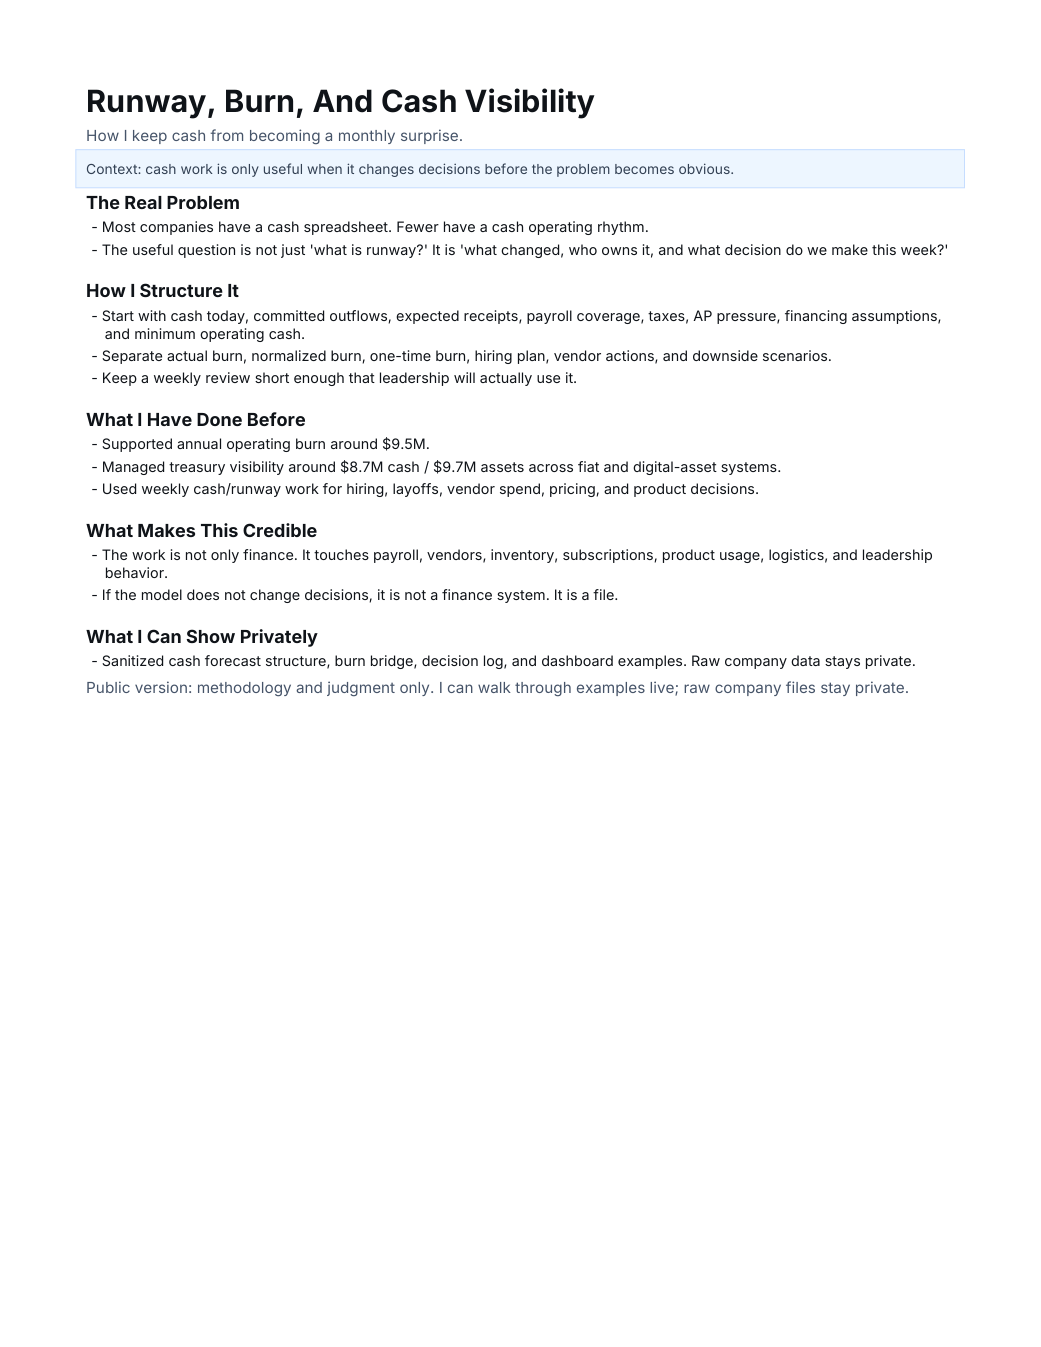 Runway, Burn, and Cash Visibility
A driver-based view built for weekly cash and operating decisions.
Runway, Burn, and Cash Visibility
A driver-based view built for weekly cash and operating decisions.
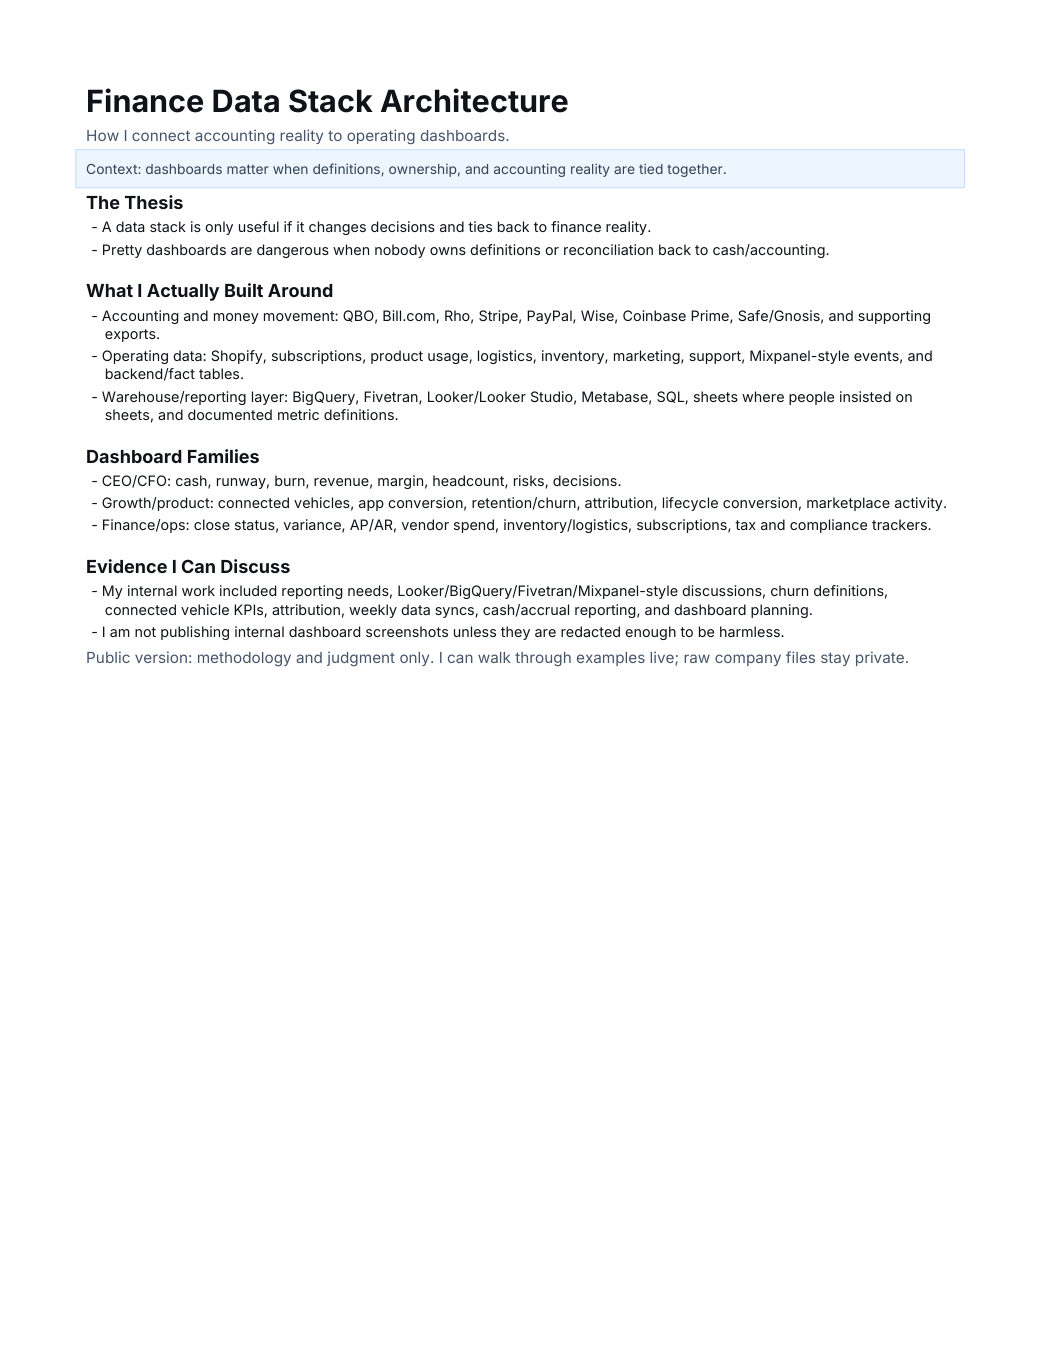 Finance Data Stack Architecture
A source-to-report design connecting accounting, operations, controls, and BI.
Finance Data Stack Architecture
A source-to-report design connecting accounting, operations, controls, and BI.
Two reporting surfaces from my work. They show how I turn sales and protocol data into clear, usable views rather than static analysis.
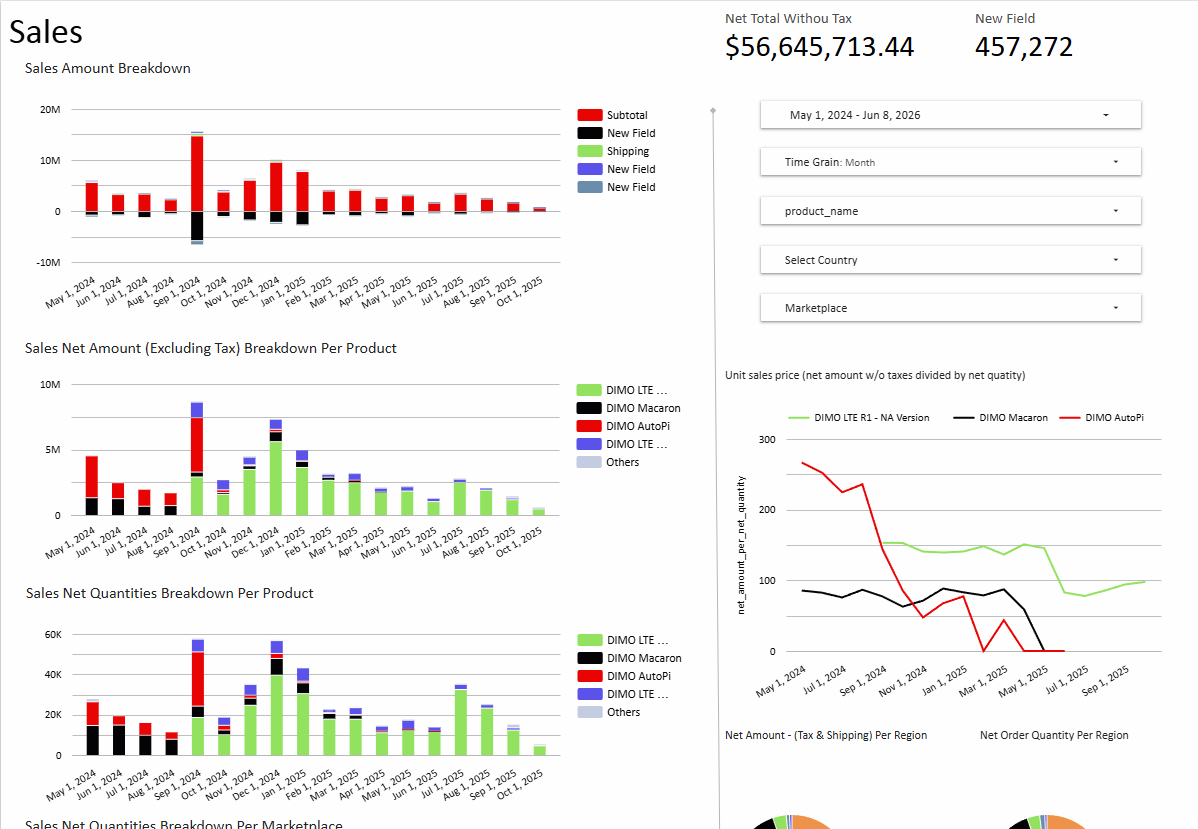 Dashboard screenshot + source link
Looker Studio Sales Dashboard
A reporting surface for sales performance, trends, and operating visibility. Google may request access when the source link opens.
Dashboard screenshot + source link
Looker Studio Sales Dashboard
A reporting surface for sales performance, trends, and operating visibility. Google may request access when the source link opens.
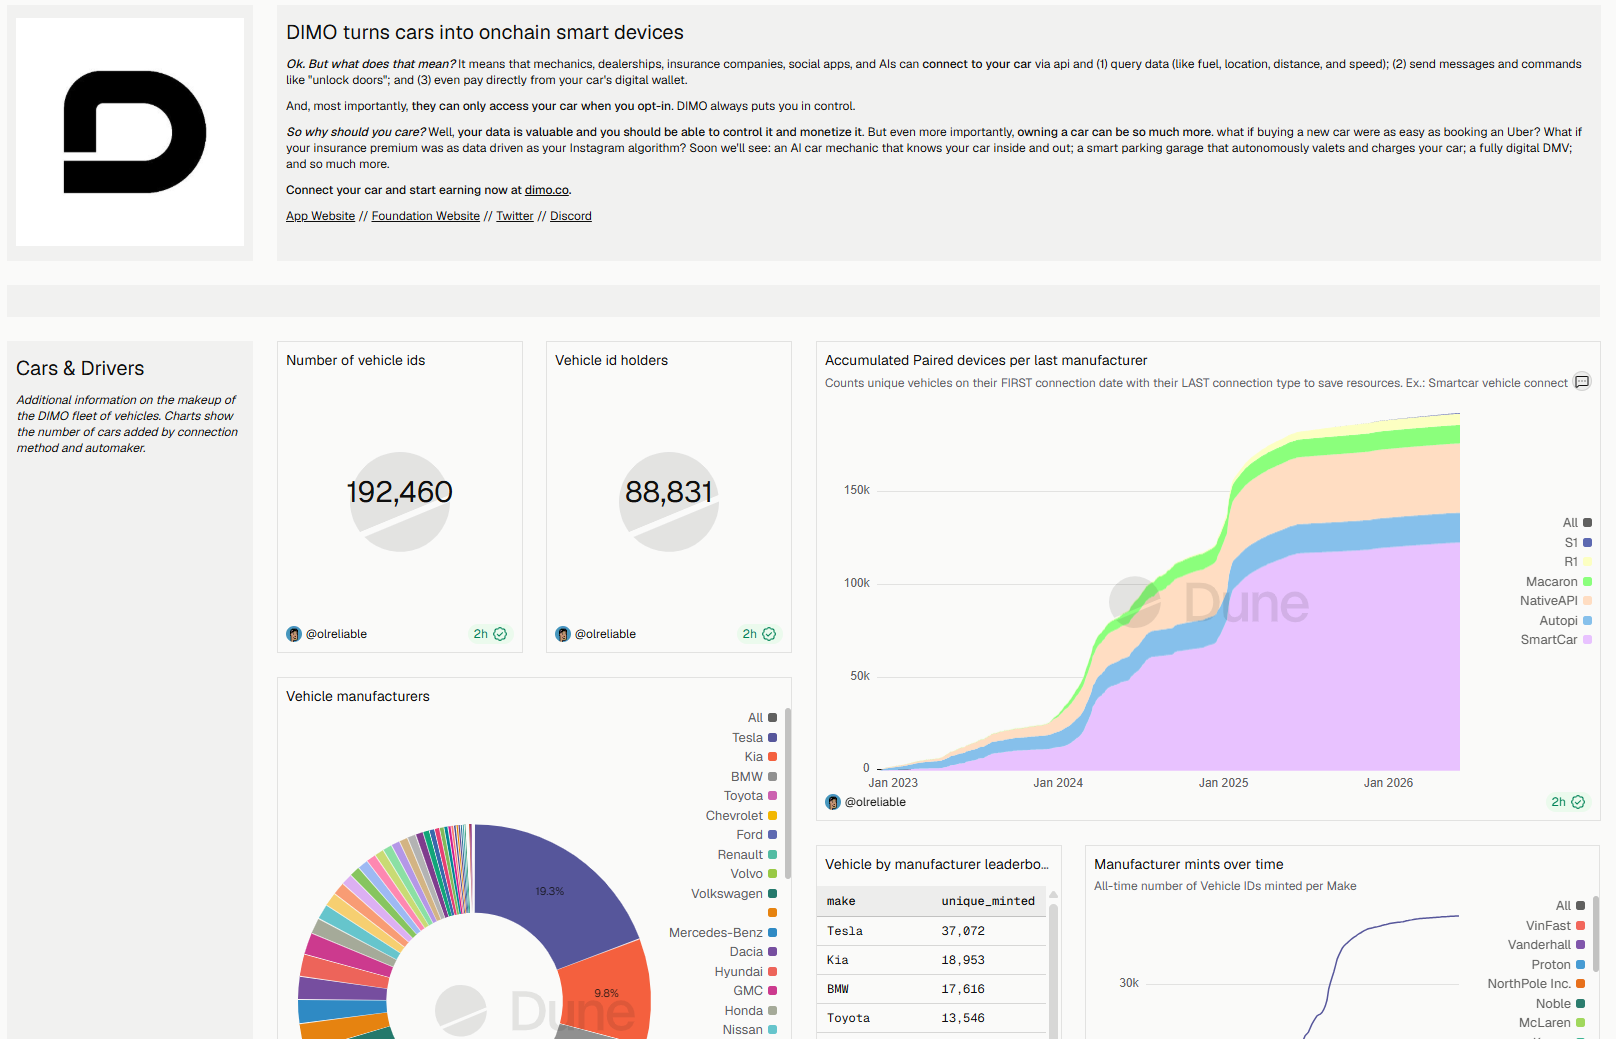 Public dashboard
DIMO Protocol Metrics on Dune
A public on-chain reporting surface for protocol activity and ecosystem metrics.
Public dashboard
DIMO Protocol Metrics on Dune
A public on-chain reporting surface for protocol activity and ecosystem metrics.
These case studies show what happens behind the reporting layer: how I reconstruct the source, control the close, and keep human judgment visible.
An anonymized case on turning incomplete finance records into a clear close position, a controlled action package, and a repeatable process.
Read the case studyA client-isolated system that turns provider data into canonical facts, close controls, work queues, and traceable evidence.
Read the case studyMissing-bill detection, explainable GL coding review, and owner-statement workflow on one client-scoped stack.
Read the case studyA practical entry plan for stabilizing cash, close, reporting, and decision cadence in a lean company.
Open the diagnosticEvery version uses the same chronology and evidence. The difference is which work appears first.
Specialized versions
I use the same standard here that I use in finance work: make the source, scope, and limits clear.
Public outcomes connect to sanitized artifacts, tested systems, or source records.
Raw company records and identifying transaction details are excluded or redacted.
Work samples distinguish verified results, operating methods, and illustrative presentation.
If you need finance that helps answer what happens next, email me or connect on LinkedIn.